
A customer finds the product, adds it to cart, and checks out. Three days later the order gets cancelled because the item was never in stock. The site said it was available, the ERP knew otherwise, and nothing connected the two closely enough for the site to find out in time.
That customer is gone, the acquisition cost that brought them in is a write-off, and the next campaign you send them gets ignored. Multiply it across a quarter and it turns into a number worth explaining to leadership. None of it lands on a marketing dashboard.
What you own ends at the order. Everything after it runs on systems you rarely see: the ERP, the PIM, the OMS, and the integrations moving data between them. That layer decides whether the demand you generate turns into revenue the business recognizes, and when it has friction in it, the leak lands on your number with no trail back to the cause.
Here’s what we’ll address: how backend friction leaks revenue, why it stays hidden longer than it should, the signals worth watching for, and how Bighorn approaches the fix.
How Backend Friction Leaks Revenue
Backend friction rarely announces itself. It shows up as small failures spread across the order lifecycle, each one costing a little and none of them big enough to trigger an investigation.
- Slow merchandising cycles. When every pricing update, product launch, promotion, or inventory change requires manual work across systems, you lose speed to market. Campaigns launch late, seasonal windows close before the catalog is ready, and revenue that should have been captured never enters the funnel at all. The cost never registers as a loss because the sale was never recorded in the first place.
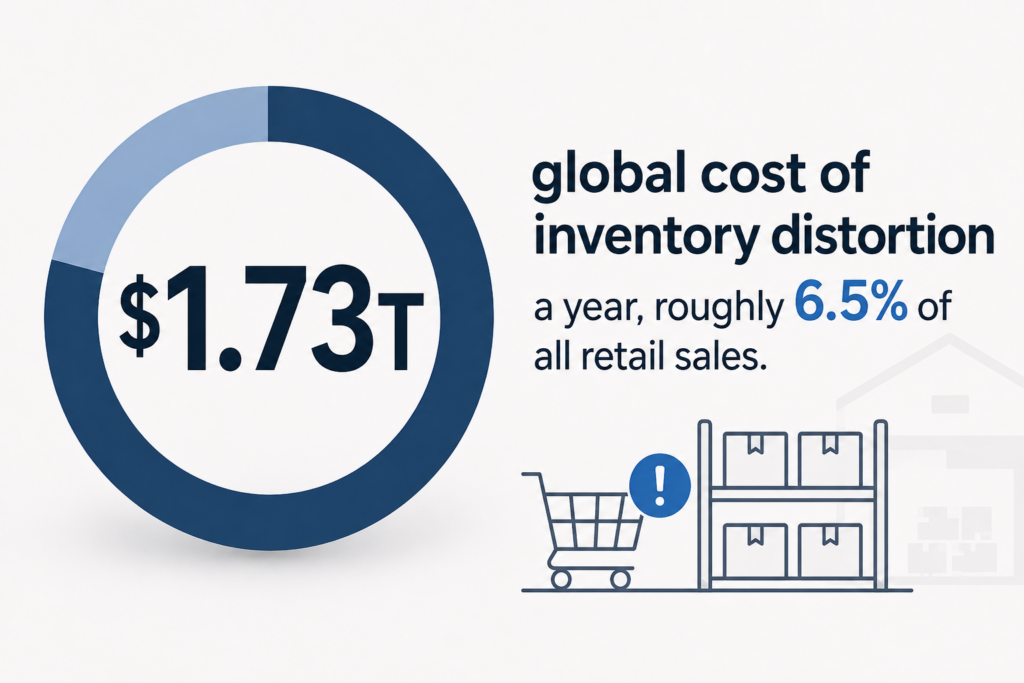
- Inventory that lies. The cancelled order above is the visible version. The quieter one is product that sits unsellable because the sync between the ERP and the storefront runs on a delay, so stock that exists never appears as available. You pay to drive traffic to a page that says sold out while the warehouse has forty units. Further, the global cost of inventory distortion at $1.73 trillion a year, roughly 6.5% of all retail sales.
- Checkout that behaves inconsistently. Payment methods, tax logic, shipping calculations, and promo engines all depend on data moving cleanly between the storefront and the back office. When one of them behaves differently than expected, the drop happens in real time and shows up in analytics as normal abandonment, which nobody investigates.
- Product data that’s slightly wrong. Pricing, descriptions, images, and availability that fall out of sync create edge cases where the customer sees one thing and the back office processes another. The customer catches it at checkout, abandons, and the analytics record it as a UX problem.
- Manual workarounds that become bottlenecks. When systems don’t talk, people fill the gap. That works at low volume. As volume grows, the number of orders your team can process by hand becomes the ceiling on what the business can sell, and that ceiling drops every time complexity goes up.
Data delays that skew decisions. Reporting lag between systems means you optimize against yesterday’s numbers, ops fights last week’s problems, and leadership makes calls on a picture that’s already stale. The decisions look reasonable and the outcomes drift.
Individually, none of these will show up as a line item anyone can point to. Together they cap how much of the demand you generate turns into revenue.
Why Backend Friction Stays Hidden
The visibility gap is structural. It comes from how the two sides of the business get measured.
Your dashboards report on the work you own: traffic, conversion, campaign performance, channel attribution, cost per acquisition. Every one of those metrics stops at the order confirmation page. What happens in the next forty-eight hours runs on a different set of dashboards, owned by a different team, measuring completely different things. Whether the order syncs cleanly, whether inventory reconciles, whether fulfillment receives the right data, all of it sits outside your view.
Ops measures sync speed, error rates, exception queues, and ticket volume. Those numbers can look healthy while revenue leaks, because a sync that completes successfully at 6am is still a sync that ran twelve hours late for the customer who checked out the night before. Both teams see their own version of fine.
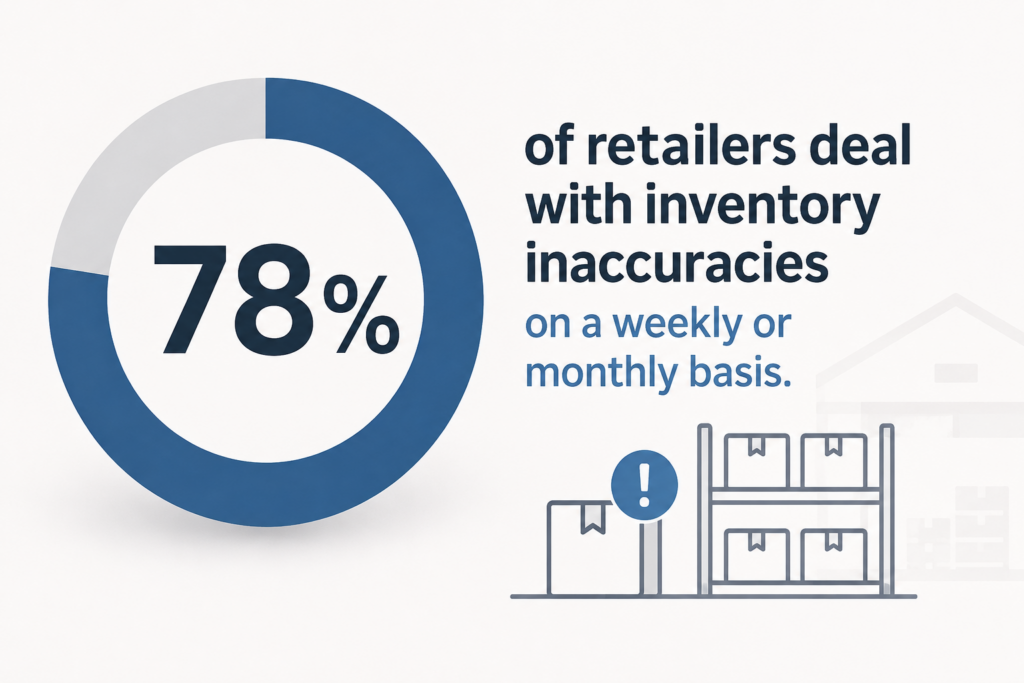
So the friction runs for months. It compounds quietly, surfaces eventually as a revenue drop, and by the time anyone connects the two, the trail back to the cause has gone cold. So the friction runs for months. It compounds quietly, surfaces eventually as a revenue drop, and by the time anyone connects the two, the trail back to the cause has gone cold. That gap is close to universal: 78% of retailers deal with inventory inaccuracies on a weekly or monthly basis.
The Signals Worth Watching For
You can spot backend friction before it hits the revenue number. The signals live in places you don’t usually look, and most of them belong to someone else’s dashboard.
- Cart abandonment climbing without a UX change. When abandonment moves and nothing on the front end shipped, the friction is downstream. Checkout, tax, shipping, or payment logic behaving differently than it did last quarter.
- Customer service ticket themes. Order status, delivery dates, inventory availability. Support sees backend friction weeks before it reaches your dashboard, and the ticket categories tell you exactly which system is failing.
- Site and invoice disagreeing. Price mismatches, quantity issues, delivery estimates that don’t hold. Every one of those is a data sync problem wearing a customer experience costume.
- Ops handling more by hand every quarter. When the team is manually processing more orders than they were six months ago on similar volume, the systems are losing ground and the workflow is holding revenue that should already be recognized.
- Marketing and finance closing the month differently. When two teams report different revenue for the same period, the reconciliation layer between systems has friction in it.
The strongest signal is harder to see on any single report. It shows up when marketing, operations, finance, and customer service each describe a different version of the same problem. That pattern usually means the friction lives in the systems connecting those teams rather than inside any one of them. Any two of these together are worth taking to your CTO or COO for a joint look.
How Bighorn Approaches Backend Friction
The work starts with questions. What does the order lifecycle actually look like end to end? Where does data stop moving cleanly? What is the team compensating for by hand every day? Every engagement opens with a hypothesis about where revenue is getting held up, and then we go find out whether it’s right.
- Dig into the business, the operations, and the analytics. Numbers come from both sides: conversion, abandonment, and revenue on one, sync errors, order exceptions, and manual handling volume on the other. The pattern surfaces when both sets sit on the same table, which is usually the first time anyone has looked at them together.
- Prioritize by revenue impact. Not every backend fix earns a place in the roadmap. The ones that go first sit on the highest-traffic, highest-intent paths, where a small improvement compounds fast. Everything else waits its turn.
- Fix at the layer where the friction lives. Point fixes on individual integrations create new debt and buy six months of quiet before the same problem resurfaces somewhere adjacent. Work that holds up has to survive more channels, more SKUs, and more complexity than the business has today.
- Track it back to revenue. A sync that stops erroring is a milestone. The work is complete when the revenue number responds.
What makes this work is who’s in the room. Everyone at Bighorn is senior or architect level, and everyone joins client-facing meetings. The people who diagnose the problem are the same people who build the fix, so nothing gets lost between the scoping conversation and the delivery. That structure is a large part of why our clients stay.
What This Looks Like in Practice
The pattern shows up clearly in the work. Two brands, both running STORIS as their operational backbone, both with revenue sitting behind an integration layer that wasn’t keeping up.
- Seldens. STORIS ERP connected to Shopify, automating order processing, inventory management, and product data sync. The manual work that used to run daily now happens on its own, which gave the operations team back the hours they were spending on data entry and exception handling.
- Levin Furniture. Multi-brand Shopify Plus with custom PIM and middleware syncing to STORIS. Product data, inventory, custom shipping rates, protection plans, and regional pricing all move dynamically between the storefront and the back office. Total sales are up 83% and conversion is up 17%. Levin’s team owns the solution outright, which means their ceiling for growth moved up rather than getting rebuilt every time the business changed shape.
Both brands run on STORIS, and both had the same choice in front of them: keep the ecommerce platform that was already connected, or move to Shopify and take on integration risk.
Where to Start
You own the revenue number without owning the systems that decide whether it lands. That gap is real, and closing it doesn’t mean taking on the ops work yourself. It means seeing the friction clearly enough to bring the right conversation to the right people, with enough specifics that it gets taken seriously.
If revenue is soft while your metrics look normal, we run a 20-minute feedback session that helps you find where the friction lives and what to do with what you find. Book a 20-min feedback session.